
Experimenting with transformer models for citation verification
Automated verification of scientific claims represents a critical application of natural language processing in maintaining research integrity. The exponential growth in scientific literature has created an urgent need for computational methods that can validate citation accuracy at scale. This article provides a systematic comparison of transformer-based architectures for scientific claim verification, evaluating their performance across multiple datasets and examining the trade-offs between model complexity, computational efficiency, and generalization capabilities.
The Problem: Verifying Scientific Claims
Scientific integrity relies on accurate citations. When researchers cite previous work, these citations should faithfully represent the original findings. But with millions of papers published each year, manually checking citation accuracy becomes impossible.
For this project, I worked with two specialized datasets:
- SciFact: 1,400 examples of claims paired with evidence sentences from scientific paper abstracts
- Citation-Integrity: 3,000 examples of claim-evidence pairs extracted from full biomedical articles
Both datasets classify claim-evidence relationships into three categories: Support, Refute, or Not Enough Information (NEI). These categories align with established natural language inference paradigms (entailment, contradiction, neutral).
Text length is an important consideration for NLP models. The plot (made using this script) shows the number of tokens in the combined claim-evidence pairs for each dataset. The majority of texts are under 500 tokens, but some are longer. Intuitively, models that can handle longer inputs should perform better, but this comes with a computational cost that is explored in more detail below.

Number of tokens generated by the BERT tokenizer with a maximum sequence length of 1024 tokens.
The Models
I compared three transformer-based models with different architectures and pretraining strategies:
BERT: The Baseline Classic
BERT (Bidirectional Encoder Representations from Transformers) revolutionized NLP when it was introduced in 2018. It is pretrained on two taks: Masked language modeling and Next Sentence Prediction. Despite being an older model, it remains a valuable baseline because of its widespread use. Here I use the bert-base-uncased model, which has 184M parameters and processes sequences up to 512 tokens.
Longformer: Built for Longer Documents
Standard transformers struggle with long documents because their self-attention mechanism scales quadratically with sequence length. Longformer solves this with a linear-scaling attention mechanism that combines local windowed attention with task-motivated global attention. I used the MultiVerS implementation, which was state-of-the-art for SciFact when it was published. MutiVerS’s Longformer checkpoint is pretrained on the Fever dataset (Fact Extraction and VERification dataset derived from Wikipedia; size: 185K) and two science-domain datasets (EvidenceInference and PubmedQA).
DeBERTa: Enhanced Attention Mechanisms
DeBERTa (Decoding-enhanced BERT with disentangled attention) uses separate vectors for content and position, unlike BERT’s combined representation. This helps the model better understand relationships between words that appear near each other. I tested DeBERTa-base in two configurations with sequence lengths of 512 and 1024 tokens. I used the DeBERTa-v3-base model pretrained on three datasets: Fever, MNLI, and ANLI.
Experimental Design
Training Protocol
I set up an automated training process to ensure reproducible results:
- All models were evaluated both zero-shot (no fine-tuning) and after fine-tuning
- Initial fine-tuning ran for 5 epochs based on previous research benchmarks
- Learning rate (2e-5) and weight decay (0.01) were kept constant across models
- Metrics were calculated on all data splits (train, validation, test) to ensure representative results
Cross-Validation and Hyperparameter Tuning
For the most promising model (DeBERTa-512), I conducted further experiments:
- Ran multiple replication experiments to account for random initialization effects
- Systematically varied dropout probabilities
- Tested modified architectures with fewer hidden layers and attention heads
- Tracked learning curves to identify optimal stopping points
Performance Metrics
I selected multiple metrics to provide a comprehensive view of model performance:
- Accuracy
- F1 scores for each class (Support, Refute, NEI). While accuracy became my primary metric for later experiments, tracking class-specific F1 scores was crucial to ensure the model performed well across all verification classes, especially the challenging “Refute” class.
- AUROC (area under the receiver operating characteristic curve). From the torchmetrics docs: “The AUROC score summarizes the ROC curve into an single number that describes the performance of a model for multiple thresholds at the same time”. The AUROC score ranges from 0.5 for random guessing to 1 for perfect classification.
The Code
Longformer (MultiVerS)
Predictions were made using the MultiVerS model with Longformer.
These scripts use the eval Python module and model predictions available in the AI4citations repository at https://github.com/jedick/AI4citations.
Several sets of predictions are available with different pretraining and fine tuning configurations:
import eval

## Predictions for validation (dev) sets -- used for model comparisons
# Model pretrained on FeverSci with no fine-tuning on SciFact
predictions_file = 'predictions/baseline/fever_sci_scifact_dev.jsonl'
# Model pretrained on FeverSci with 5 epochs of fine-tuning on
# SciFact and rationale_weight set to 0
predictions_file = 'predictions/ckpt_rationale_dev/fever_sci_scifact_0.jsonl'

## Predictions for test sets -- i.e. previous SOTA baselines
# Checkpoint provided by MultiVerS study for the SciFact dataset
predictions_file = 'predictions/baseline/scifact_scifact_test.jsonl'
# Checkpoint provided by Citation-Integrity study
predictions_file = 'predictions/baseline/citint_citint_test.jsonl'
This script shows how metrics are calculated.
import eval
data = eval.read_data('data/scifact', 'dev')
predictions_file = 'predictions/baseline/fever_sci_scifact_dev.jsonl'
predictions = eval.read_predictions(predictions_file, get_label_probs=True)
# Outputs F1 for REFUTE, NEI, SUPPORT, and micro and macro averages in that order
print(eval.calc_metric(data, predictions))
# AUROC
print(eval.calc_auroc(data, predictions))
# Accuracy
print(sum(predictions.label == data.label) / data.shape[0] * 100)
DeBERTa
This script uses PyTorch Lightning and the pyvers package to automate the hyperparameter search and log validation and test metrics. Other scripts were used for training on multiple datasets and shuffling datasets and are available in the pyvers repo.
import torch
import pytorch_lightning as pl
from pyvers.data import FileDataModule
from pyvers.model import PyversClassifier
from pytorch_lightning.loggers import CSVLogger

# Lower precision for float32 matrix multiplications may increase performance
# https://pytorch.org/docs/stable/generated/torch.set_float32_matmul_precision.html
if torch.cuda.is_available():
    torch.set_float32_matmul_precision("medium")

attention_probs_dropout_prob = [0.1, 0.1, 0.1, 0.1, 0.2, 0.3]
hidden_dropout_prob = [0, 0.1, 0.2, 0.3, 0.1, 0.1]
hparams = zip(hidden_dropout_prob, attention_probs_dropout_prob)
for hdp, apdp in [*hparams]:
    logdir=f"apdp_{str(apdp)}_hdp_{str(hdp)}"
    csv_logger = CSVLogger("experiments/dropout", name=logdir)
    model_name = "MoritzLaurer/DeBERTa-v3-base-mnli-fever-anli"
    dm = FileDataModule(model_name, "data/scifact", batch_size=8)
    model = PyversClassifier(
        dm.model_name,
        hidden_dropout_prob=hdp,
        attention_probs_dropout_prob=apdp,
        tensorboard_logdir=f"experiments/dropout/{logdir}",
    )
    trainer = pl.Trainer(
        enable_checkpointing=False,
        logger=csv_logger,
        num_sanity_val_steps=0,
        max_epochs=11,
    )
    trainer.fit(model, datamodule=dm)
    trainer.test(model, datamodule=dm)
Notes on the script:
- A simpler version of this script was used to fine-tune BERT, using
dm=FileDataModule("bert-base-uncased")with the default batch size of 32. - This script logs metrics for all splits (train, validation, test) to CSV files for each hyperparameter setting. The script also logs metrics to TensorBoard to monitor loss and accuracy on the training and validation sets during training.
Results: The Numbers Speak
Model Comparison
After fine-tuning for five epochs, a clear pattern emerged with DeBERTa showing the best performance:
| Model | Epochs | Accuracy | AUROC | F1_support | F1_refute | F1_NEI |
|---|---|---|---|---|---|---|
| BERT | 0 | 41 | 0.558 | 58 | 0 | 0 |
| Longformer | 0 | 69 | 0.84 | 74 | 36 | 75 |
| DeBERTa 512 | 0 | 70 | 0.851 | 71 | 59 | 73 |
| DeBERTa 1024 | 0 | 69 | 0.859 | 70 | 60 | 72 |
| BERT | 5 | 66 | 0.733 | 69 | 0 | 80 |
| Longformer | 5 | 82 | 0.923 | 84 | 68 | 86 |
| DeBERTa 512 | 5 | 83.7 | 0.948 | 84.0 | 81.7 | 85 |
| DeBERTa 1024 | 5 | 84 | 0.955 | 85.3 | 79.3 | 85.3 |
Metrics were calculated for the validation set in SciFact, are reported as percentages (except for AUROC), and are for single training runs for BERT and Longformer or the average of three runs for DeBERTa.
Several insights emerge from these results:
-
Zero-shot capabilities: Even without fine-tuning, DeBERTa and Longformer show strong performance, especially compared to BERT. This highlights the value of their specialized pretraining on tasks related to natural language inference.
-
The Refute challenge: Identifying contradictions (the “Refute” class) is consistently the hardest task. DeBERTa-512 excels here with an F1 score of 81.7 after fine-tuning, significantly outperforming Longformer (68).
-
Resource considerations: BERT and DeBERTa have similar model sizes (184M parameters, 2.1GB checkpoint files), while Longformer is more than twice as large (437M parameters, 4.9GB checkpoint files). Increasing DeBERTa’s sequence length from 512 to 1024 yields marginal improvements while nearly tripling the computational cost (running time of 50 seconds vs. 140 seconds per epoch on a single GPU). Therefore, DeBERTa with sequence length 512 was chosen as the best model going forward.
Notably, ranking the top 3 models by either accuracy or macro-averaged AUROC yields the same results. Accuracy was chosen for the following comparisons because it captures the main performance differences and is used in other NLP contexts (e.g. BERT for evidence retrieval and claim verification, the DeBERTa dataset, and Stanford NLI.
The Paradox of Rising Loss and Improving Accuracy
My experiments with DeBERTa revealed an intriguing phenomenon that contradicts conventional wisdom in machine learning: despite clear signs of overfitting beginning around the second epoch (as indicated by diverging training and validation loss curves), the validation accuracy continued to improve for up to 10 epochs.
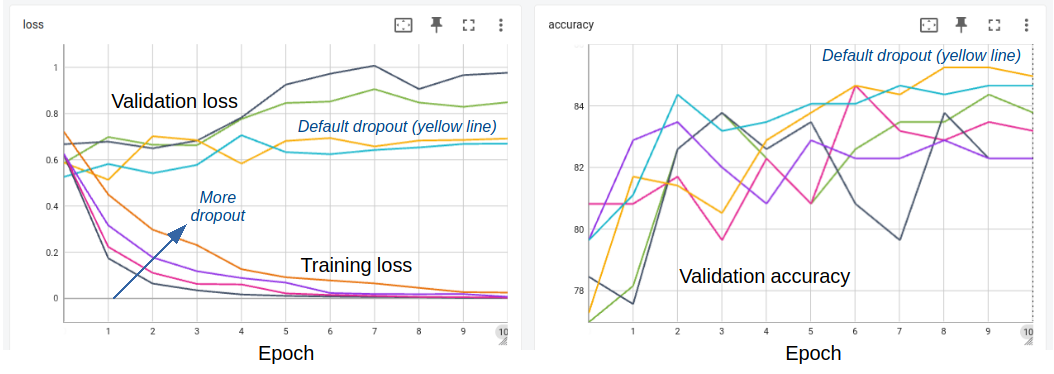
Loss and accuracy curves during fine-tuning of a pre-trained DeBERTa model on SciFact with lines for different dropout parameters. In the left panel, only hidden_dropout_prob is varied; in the right panel both hidden_dropout_prob and attention_probs_dropout_prob are varied (see script for details).
This paradoxical behavior can be explained by several factors specific to fine-tuning pre-trained language models on small datasets:
-
Cross-entropy loss vs. decision boundaries: Loss measures confidence in probability distributions while accuracy only cares about the highest probability class. This fundamental difference explains why they can trend differently.
-
Non-uniform learning dynamics: Language models demonstrate non-uniform learning across different examples and classes. Some examples are learned quickly while others require more training. This creates a scenario where the model may be simultaneously overfitting on easy examples (increasing validation loss) while still improving on difficult ones (increasing accuracy).
-
Domain adaptation effects: When fine-tuning on domain-specific data like scientific citations, extended training allows the model to better adapt its pre-trained general knowledge to the specialized vocabulary and reasoning patterns of scientific text. This adaptation process may continue well beyond the point where traditional loss metrics suggest stopping.
This observation aligns with recommendations from researchers working with BERT and similar models who often suggest extended fine-tuning epochs for small, specialized datasets (Mosbach et al., 2020; Zhang et al., 2020). The key insight is that traditional early stopping criteria based solely on validation loss may be overly conservative for pre-trained transformer models on classification tasks, potentially leaving performance on the table.
My systematic experiments with different dropout probabilities showed that the default values (hidden_dropout_prob=0.1, attention_probs_dropout_prob=0.1) performed as well or better than higher dropout rates. This suggests that DeBERTa’s architecture already includes effective regularization mechanisms.
Other techniques I tried:
- Increasing weight decay (up to 0.5)
- Reducing the number of hidden layers (from 12 to 6)
- Reducing the number of attention heads (from 12 to 6)
None of these consistently improved generalization. In fact, the latter two architectural modifications significantly harmed performance.
Cross-Dataset Generalization
A truly robust model should perform well across different datasets. To test this, I explored two training strategies:
- Sequential training: Fine-tune on SciFact for 10 epochs, then on Citation-Integrity for 10 epochs
- Mixed training: Shuffle data from both datasets and train for 10 epochs
The results were striking:
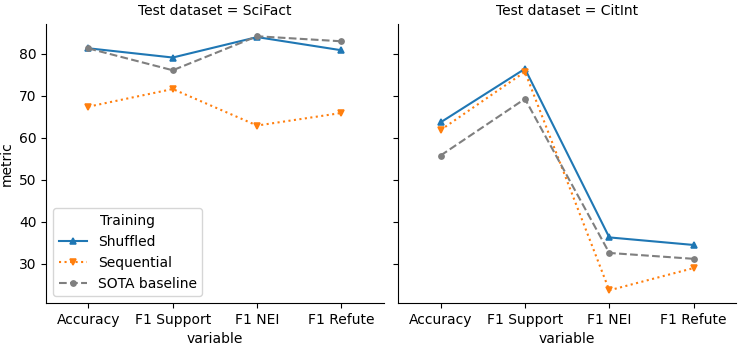
Performance of models trained on two datasets sequentially or with shuffled training data, shown as F1 scores for each class and overall accuracy of predictions on the test sets.
Shuffling data from both datasets dramatically improved performance across metrics, allowing the final model to compete with or exceed previously published best models for both datasets (Wadden et al, 2020; Sarol et al., 2024).
Conclusions and Recommendations
After extensive experimentation, I can make the following recommendations:
-
Consider the resource tradeoff: DeBERTa with 512 sequence length provides an excellent balance of performance and efficiency. It has comparable accuracy to longer sequence models (DeBERTa-1024 and Longformer) but significantly faster training times.
-
Extended fine-tuning benefits small datasets: Despite traditional indicators of overfitting, training for 10 epochs provided the best practical performance. Performance metrics like accuracy and F1 scores continued to improve in my experiments even after validation loss suggested overfitting had begun. Thus, longer fine-tuning can be beneficial for transformer-based models for small, specialized datasets.
-
Default dropout works well: The pre-configured dropout probabilities in DeBERTa performed as well as any configuration I tested, suggesting the architecture is well-tuned out of the box.
-
Mixed-dataset training yields robust models: When working with multiple datasets, shuffling examples from all datasets during training leads to better generalization than sequential training on each dataset.
The final model matches or improves upon previous state-of-the-art results for scientific claim verification, while offering a favorable balance of accuracy, training efficiency, and model size.